Data analysis for this project was done through MySQL. The complete analysis and code for this project can be found HERE
All visualizations were created using Tableau.
The goal of this project was to ask: are there any trends or insights that could be made about ICBC reported accidents at the neighborhood level in Vancouver? Once the data was acquired and appropriately labeled with the neighborhood tag, I then loaded the data into MySQL. In doing so, I created 4 tables to explore the data:
- Descriptions: Configuration of the crash (ie. Read End, Side Impact, etc) and the total number of victims in the accident.
- Locations: Neighborhood, street name and cross street of the accident, if applicable.
- Times: Year, month, day of the week and the time of day of the accident.
- Tags: Additional tags for the accident, such as whether a cyclist, animal or heavy vehicle was involved in the accident.
In analyzing the data, I used a number of more advanced SQL strategies, such as utilizing Window Functions, Subqueries and Common Table Expressions (CTE’s) in order to make more insightful and actionable queries.
Data Analysis Overview
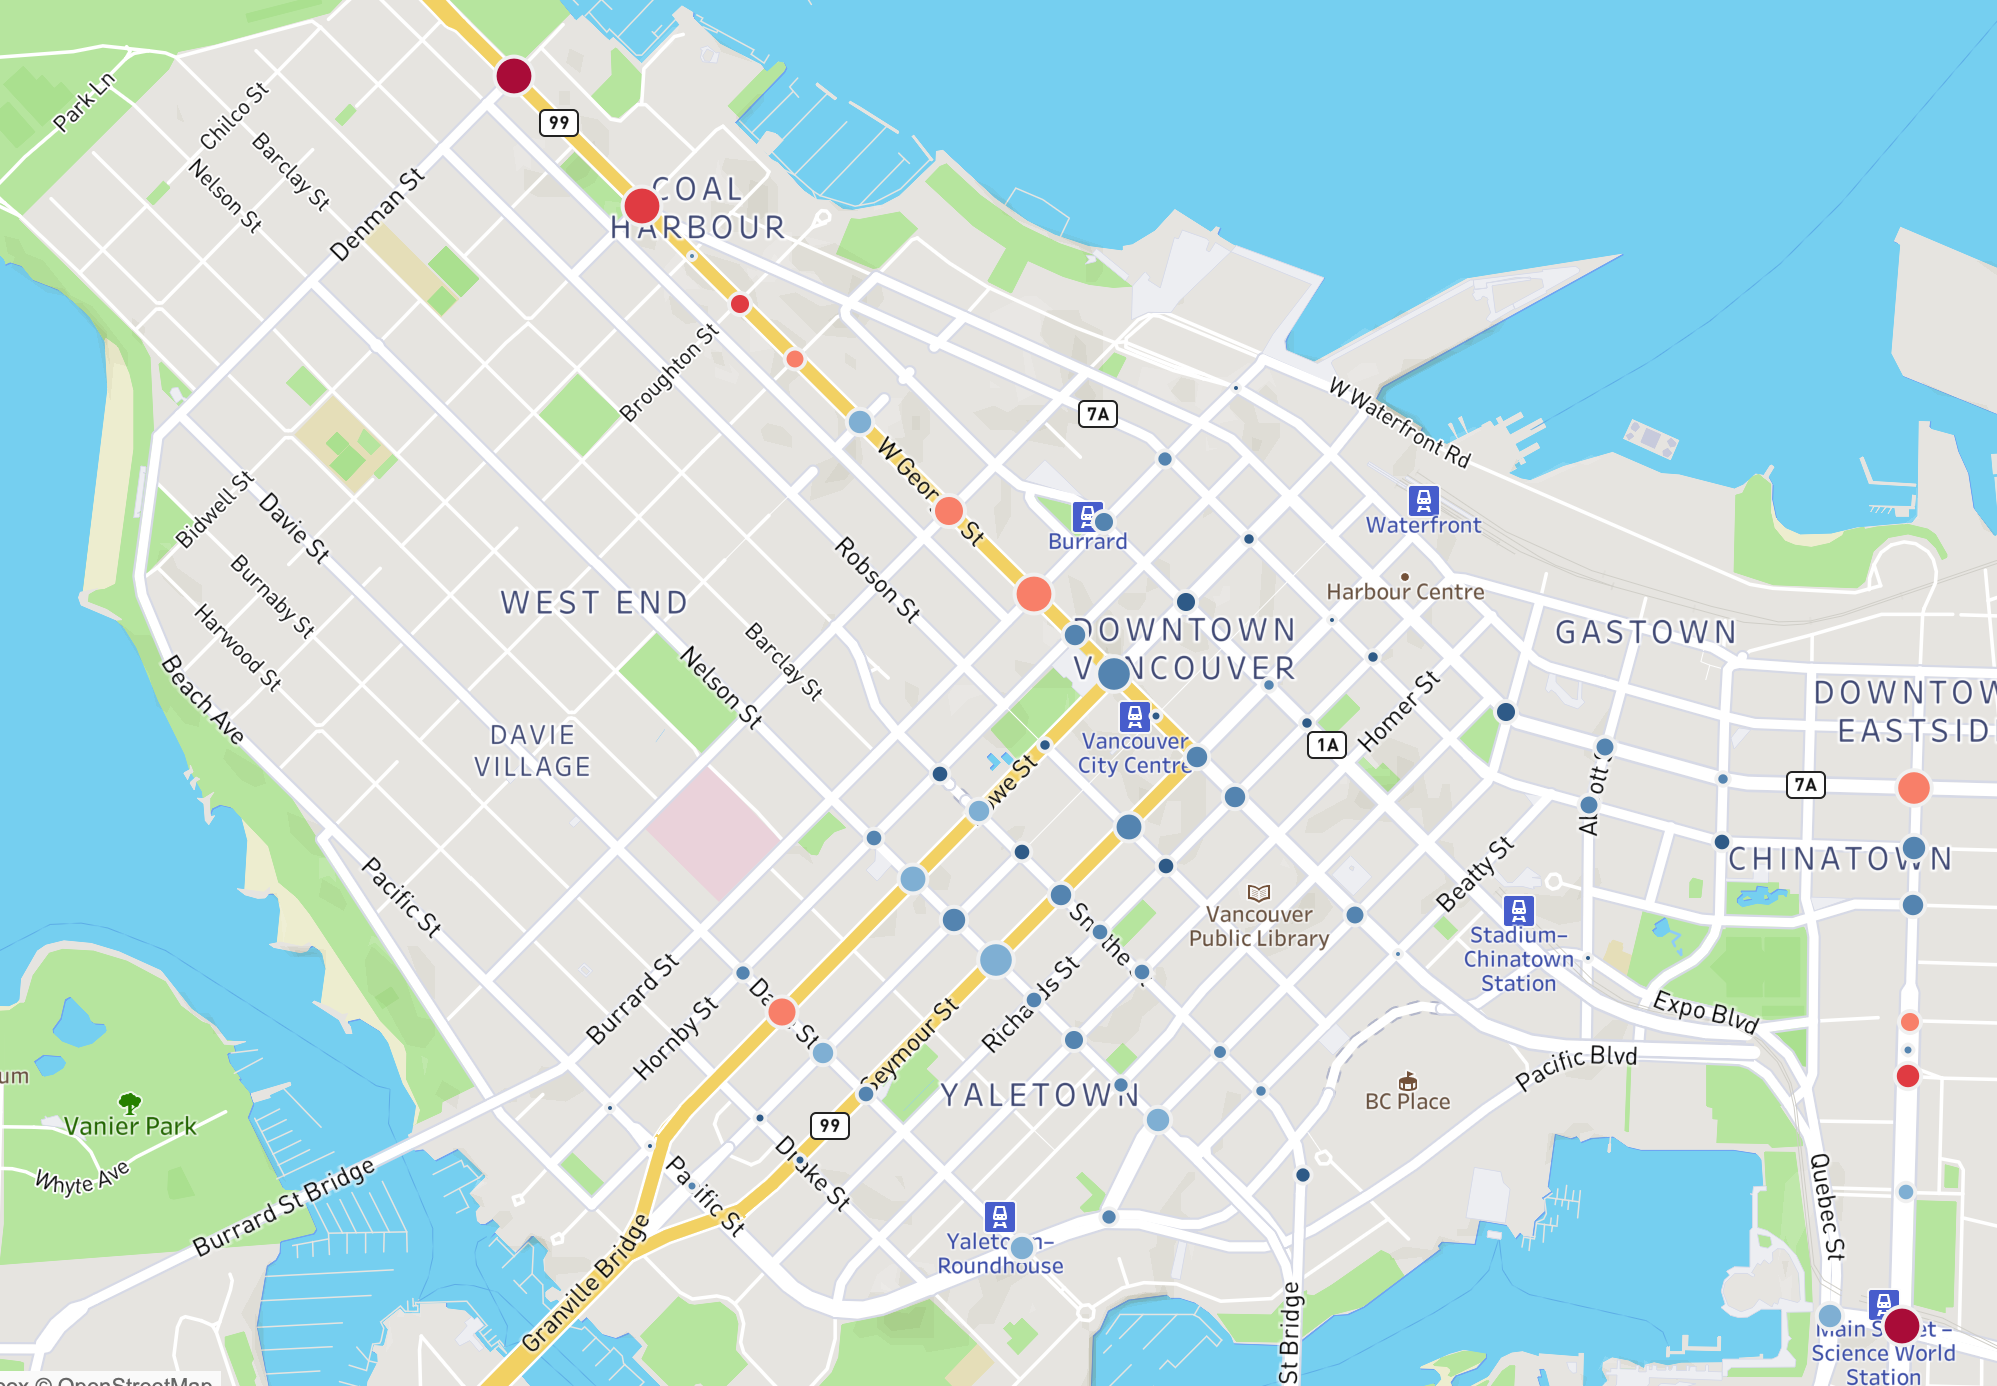
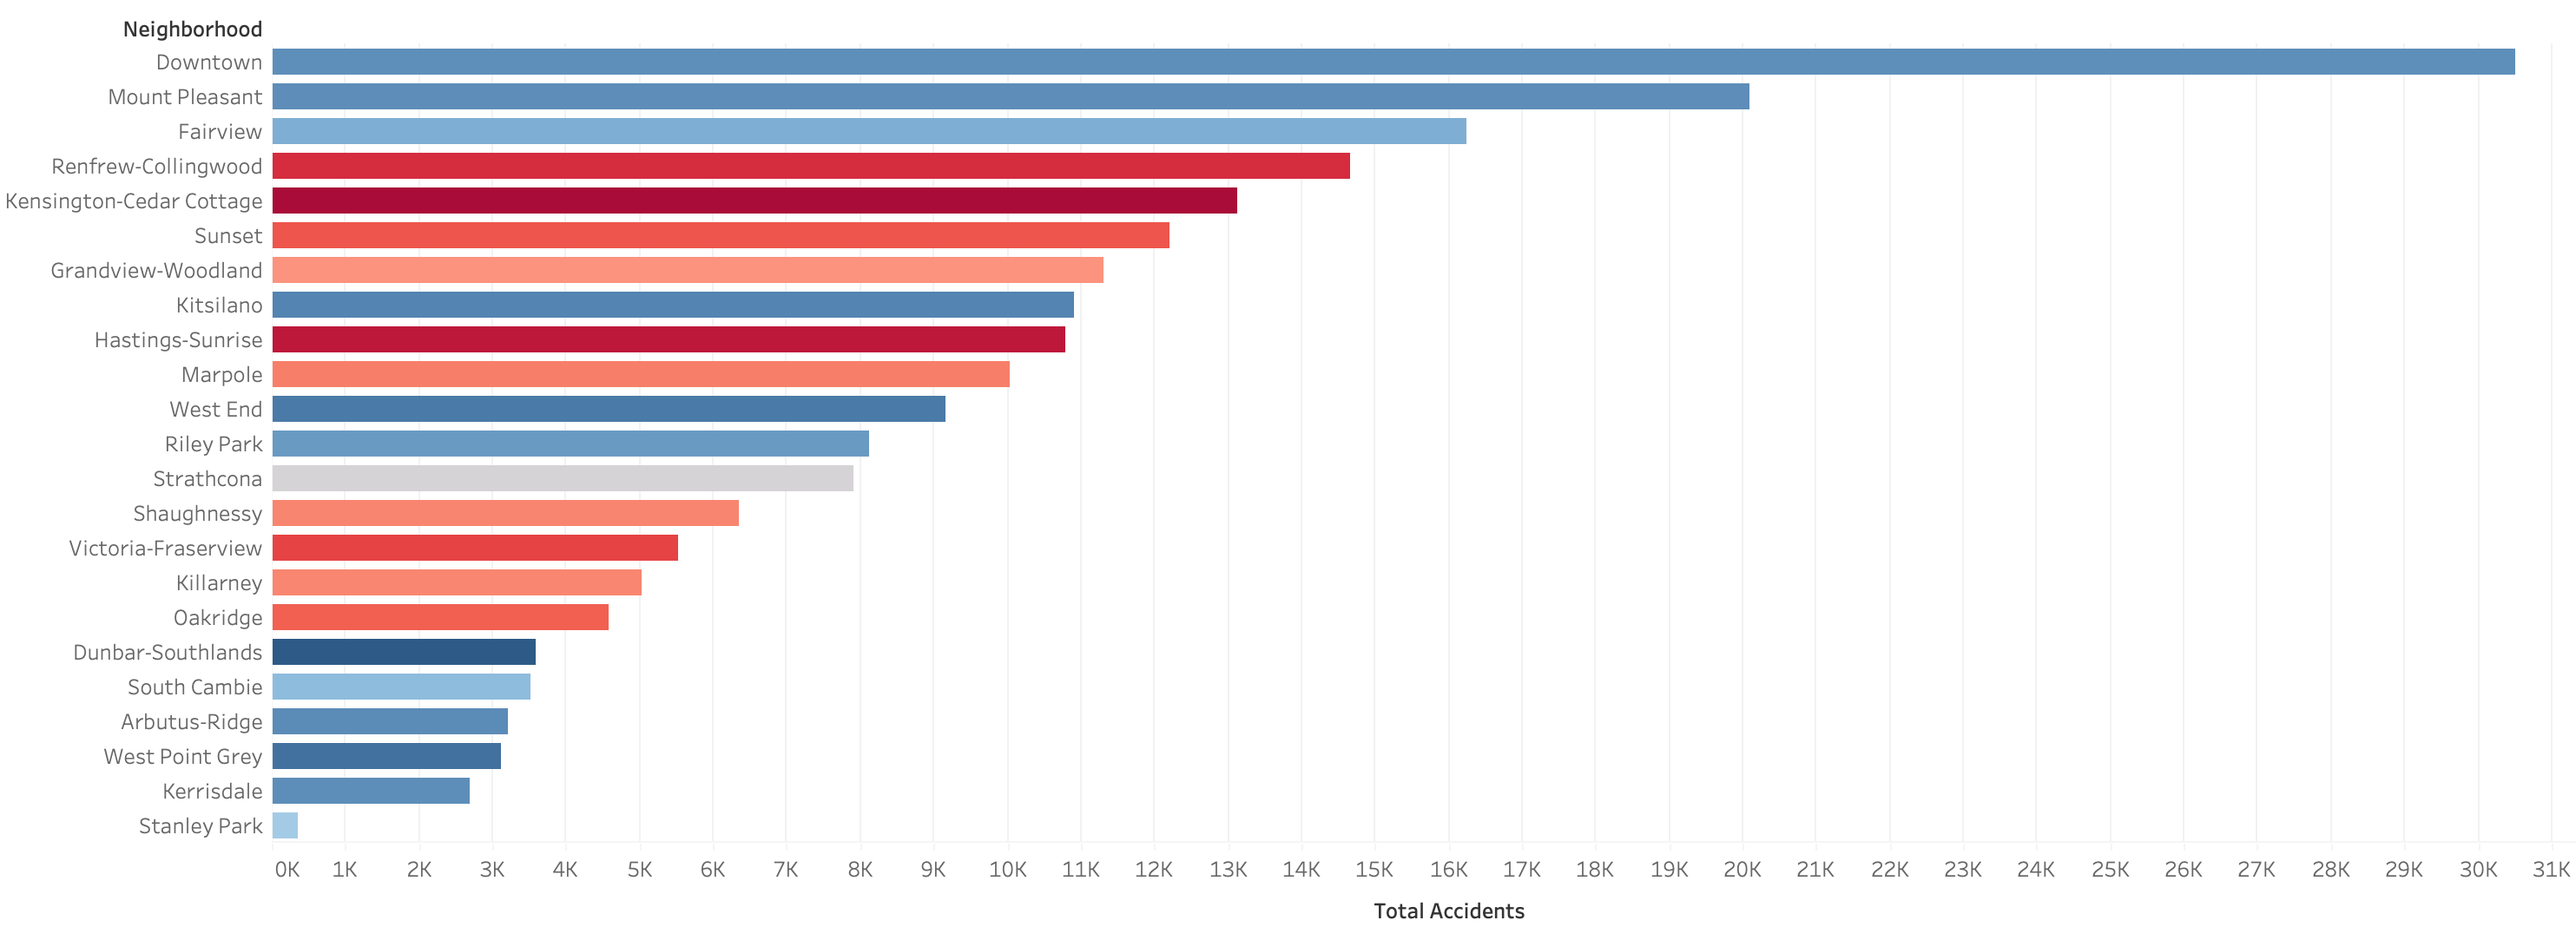
There were 213,085 accidents across 23 neighborhoods (including Stanley Park) in Vancouver from 2017-2021. Downtown had the most accidents in Vancouver with 30,516 in the 5-year span. The Downtown portion of West Georgia Street had the most accidents of any road sub-section in the city, contributing to the high number of accidents Downtown.

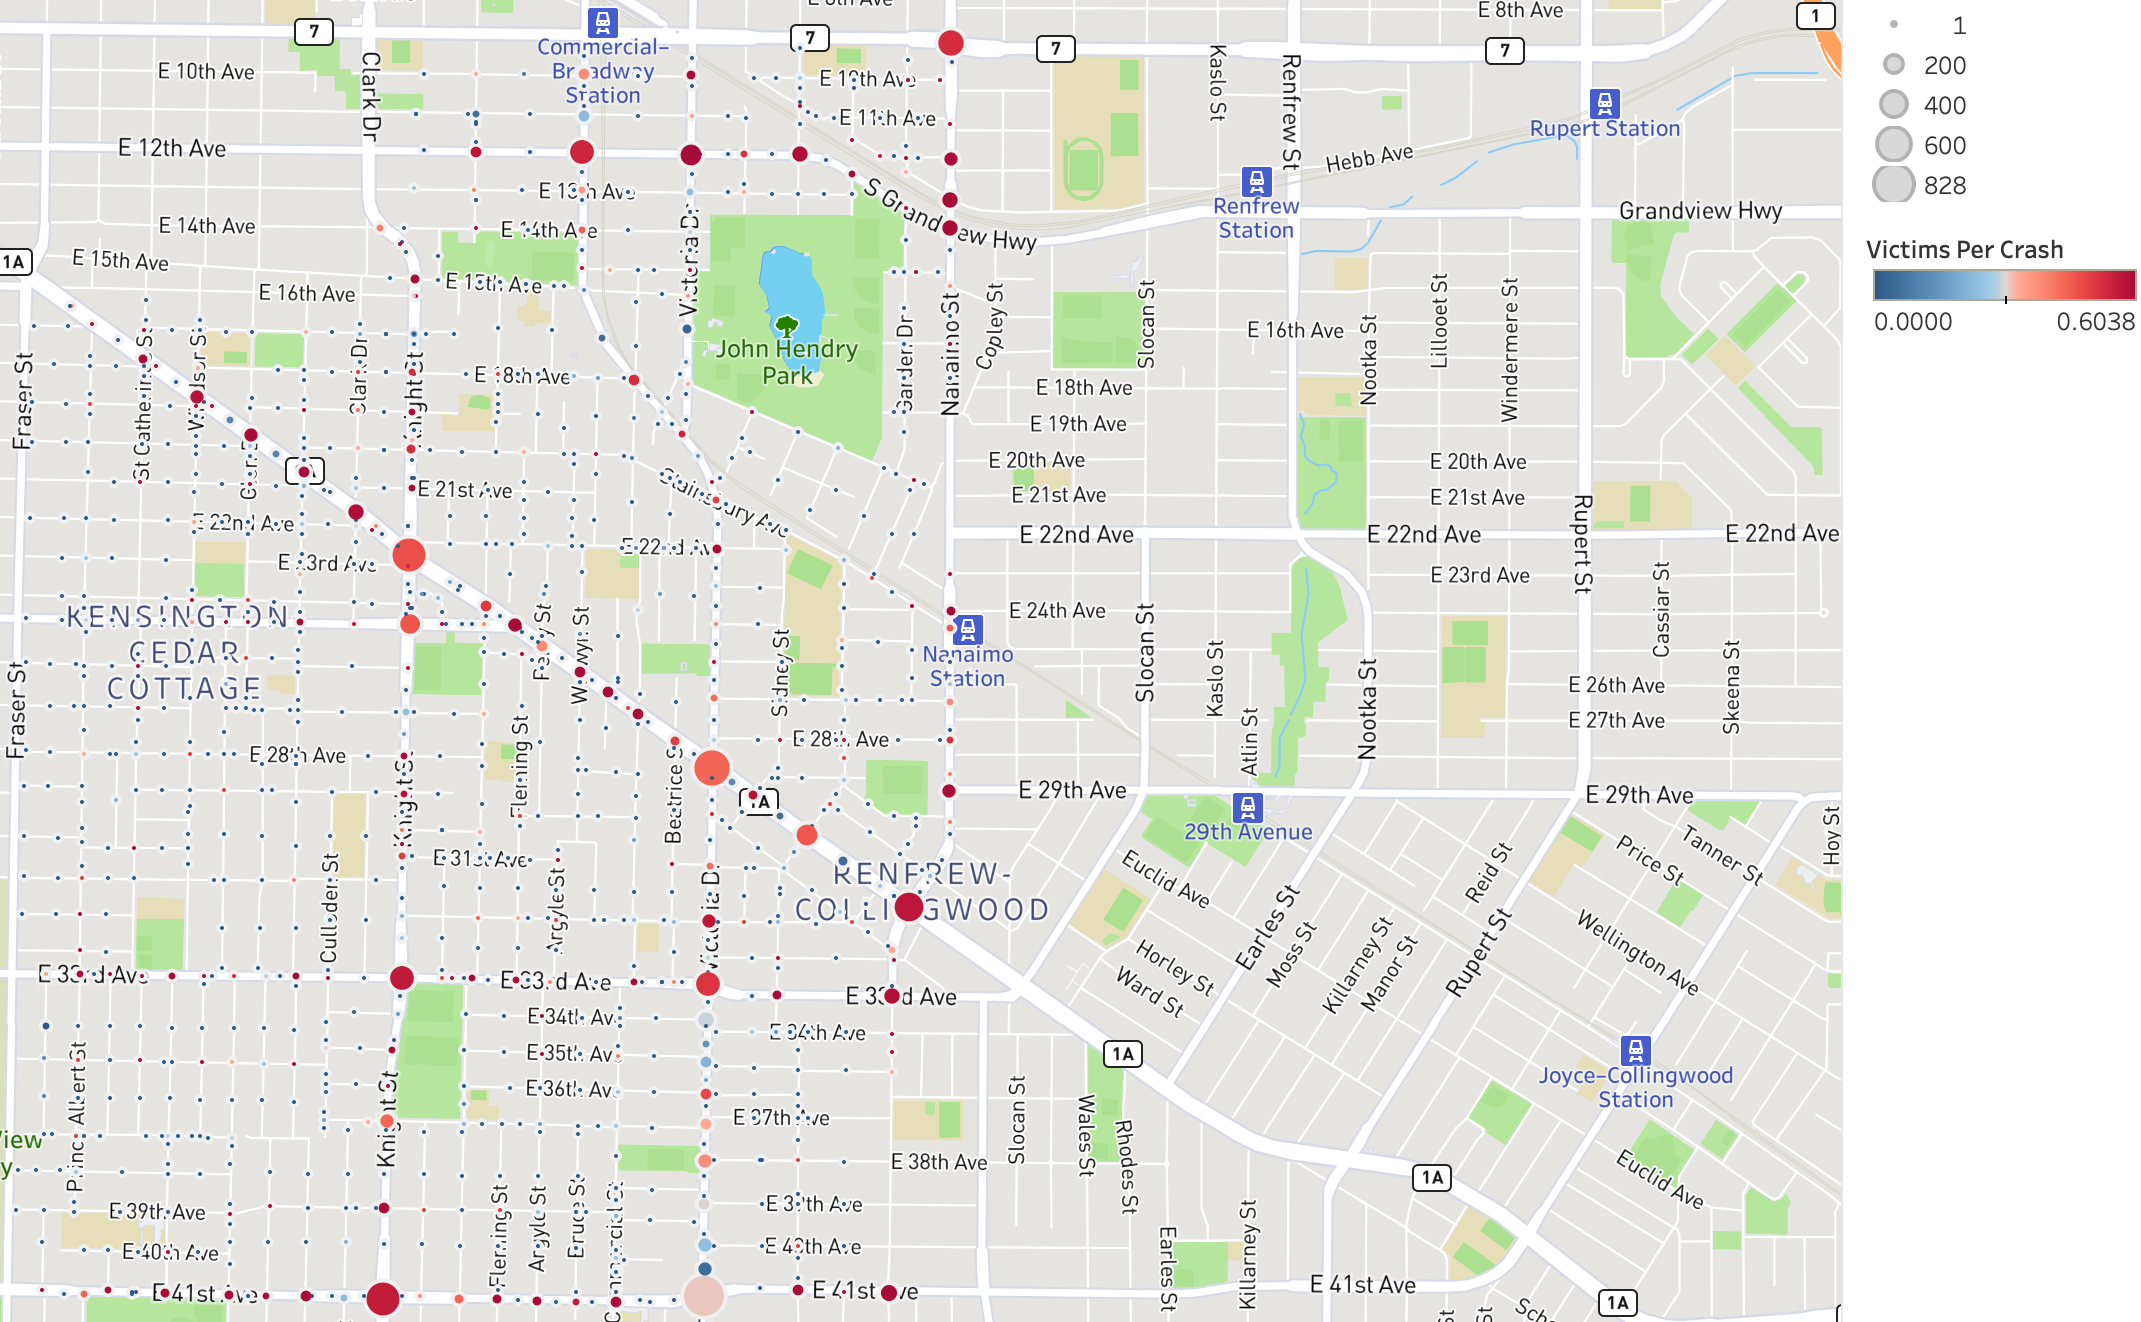
While the Kensington-Cedar Cottage Neighborhood had the 5th most accidents (13,128), it was the neighborhood that had the highest number of injured victims per accident at 0.42, well above the average of .30.

While Kingsway tranverses through several neighborhoods in Vancouver, it would appear that the sub-section that runs through Kensington-Cedar Cottage is a particularly dangerous area with numerous sites resulting in greater than average victims per accident. It is important to note that every area highlighted in red has an above average number of victims per accident, including areas that had a significantly high number of total accidents.

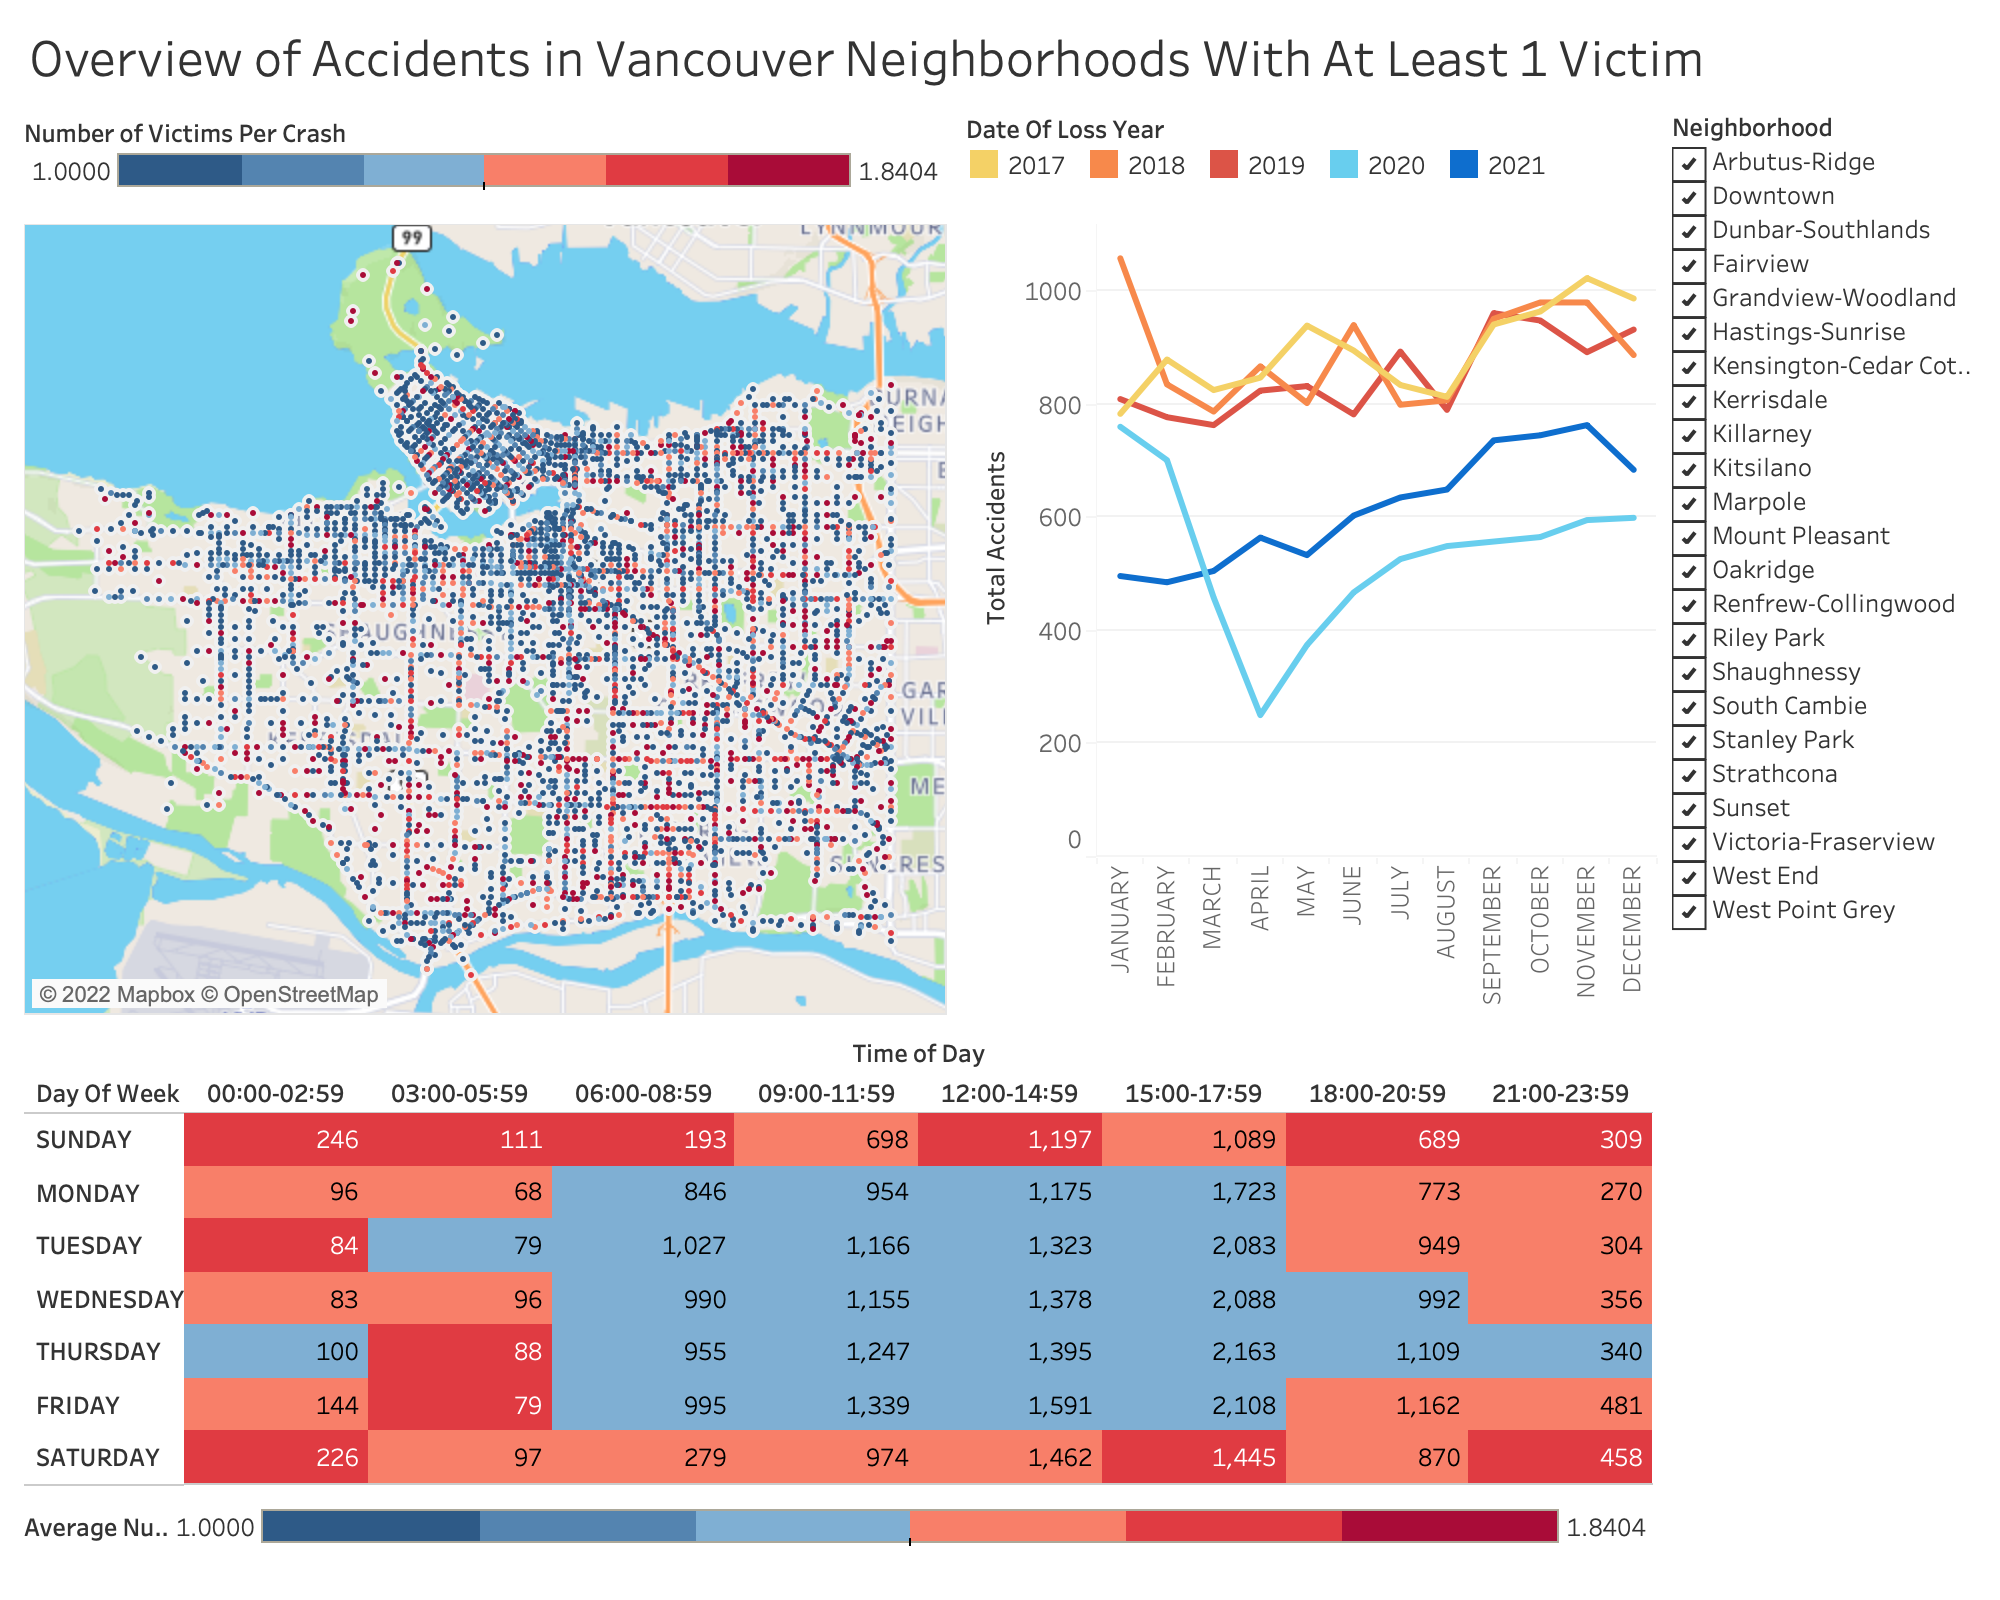
To better highlight areas of risk, I developed a dashboard that may better highlight the days and times where there are more victims during an accident. Included in this dashboard is the total number of accidents year-by-year to see the long-term trend.

A few patterns emerage when looking at all of the accidents that had at least 1 victim in Vancouver:
- The Covid-19 Pandemic certainly had an effect on the total number of accidents, with accidents dropping dramatically in April of 2020. Interestingly, accidents still had not returned to pre-pandemic levels by December of 2021.
- The 15:00-17:59 time frame has the highest number of accidents with at least 1 victim on 6 of the 7 days of the week, whereas Sunday has a nearly equal amount of accidents with a victim during the 12:00-14:59 and the 15:00-17:59 time frames.
- Accidents on the weekend have a significantly higher number of victims per accident across the city. Late Saturday night and into early Sunday morning seems to be the most dangerous time frame resulting in the highest number of victims per accident across the whole week, ranging from 1.60 to 1.68 victims per accident.
This provides an overview of the data analysis that I conducted in MySQL and Tableau. A more complete analysis can be found HERE.
While the goal of this project was to explore the data and find high-level trends, with accidents labeled properly with the neighborhoods an automated report could be produced for each neighborhood in Vancouver. In doing so, preventative measures could be distributed to higher risk areas and, in consultation with local police, more resources could be dispersed in order to minimize the total number and the impact of accidents across Vancouver.